
Project information
- Category: Backend & APIs
- Project URL: maranello.hopto.org
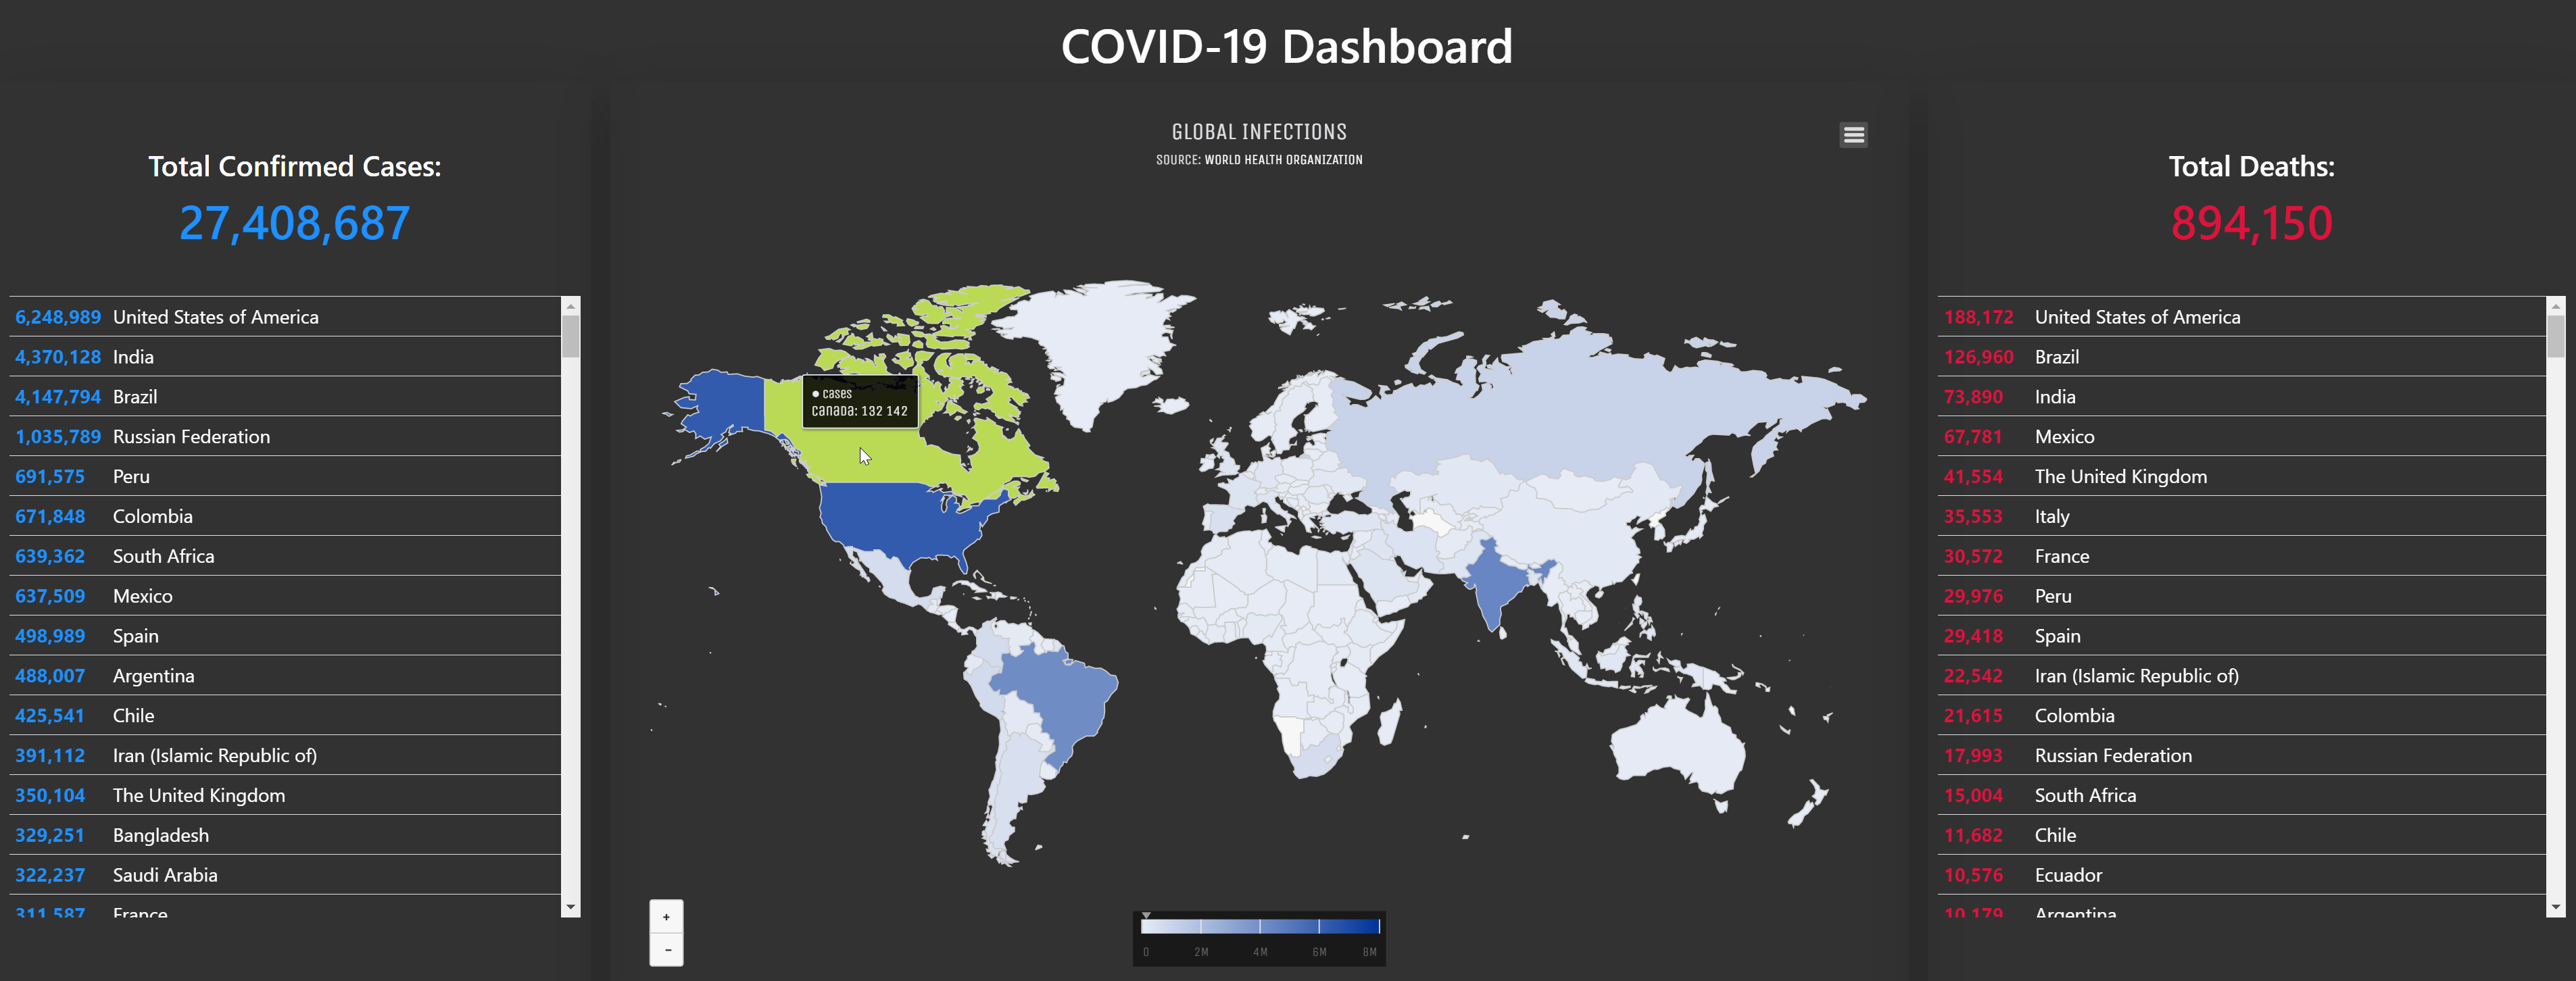
A COVID Dashboard.
This is a dashboard fed from the World Health Organization's daily data.
Features
- On page-load, the data is read from the WHO's csv to a Pandas DataFrame. From there, several DataFrames are created, and feed the several parts of the dashboard.
- The world map is created as a Heat Map; the more infected a country is, the darker its color on the map.
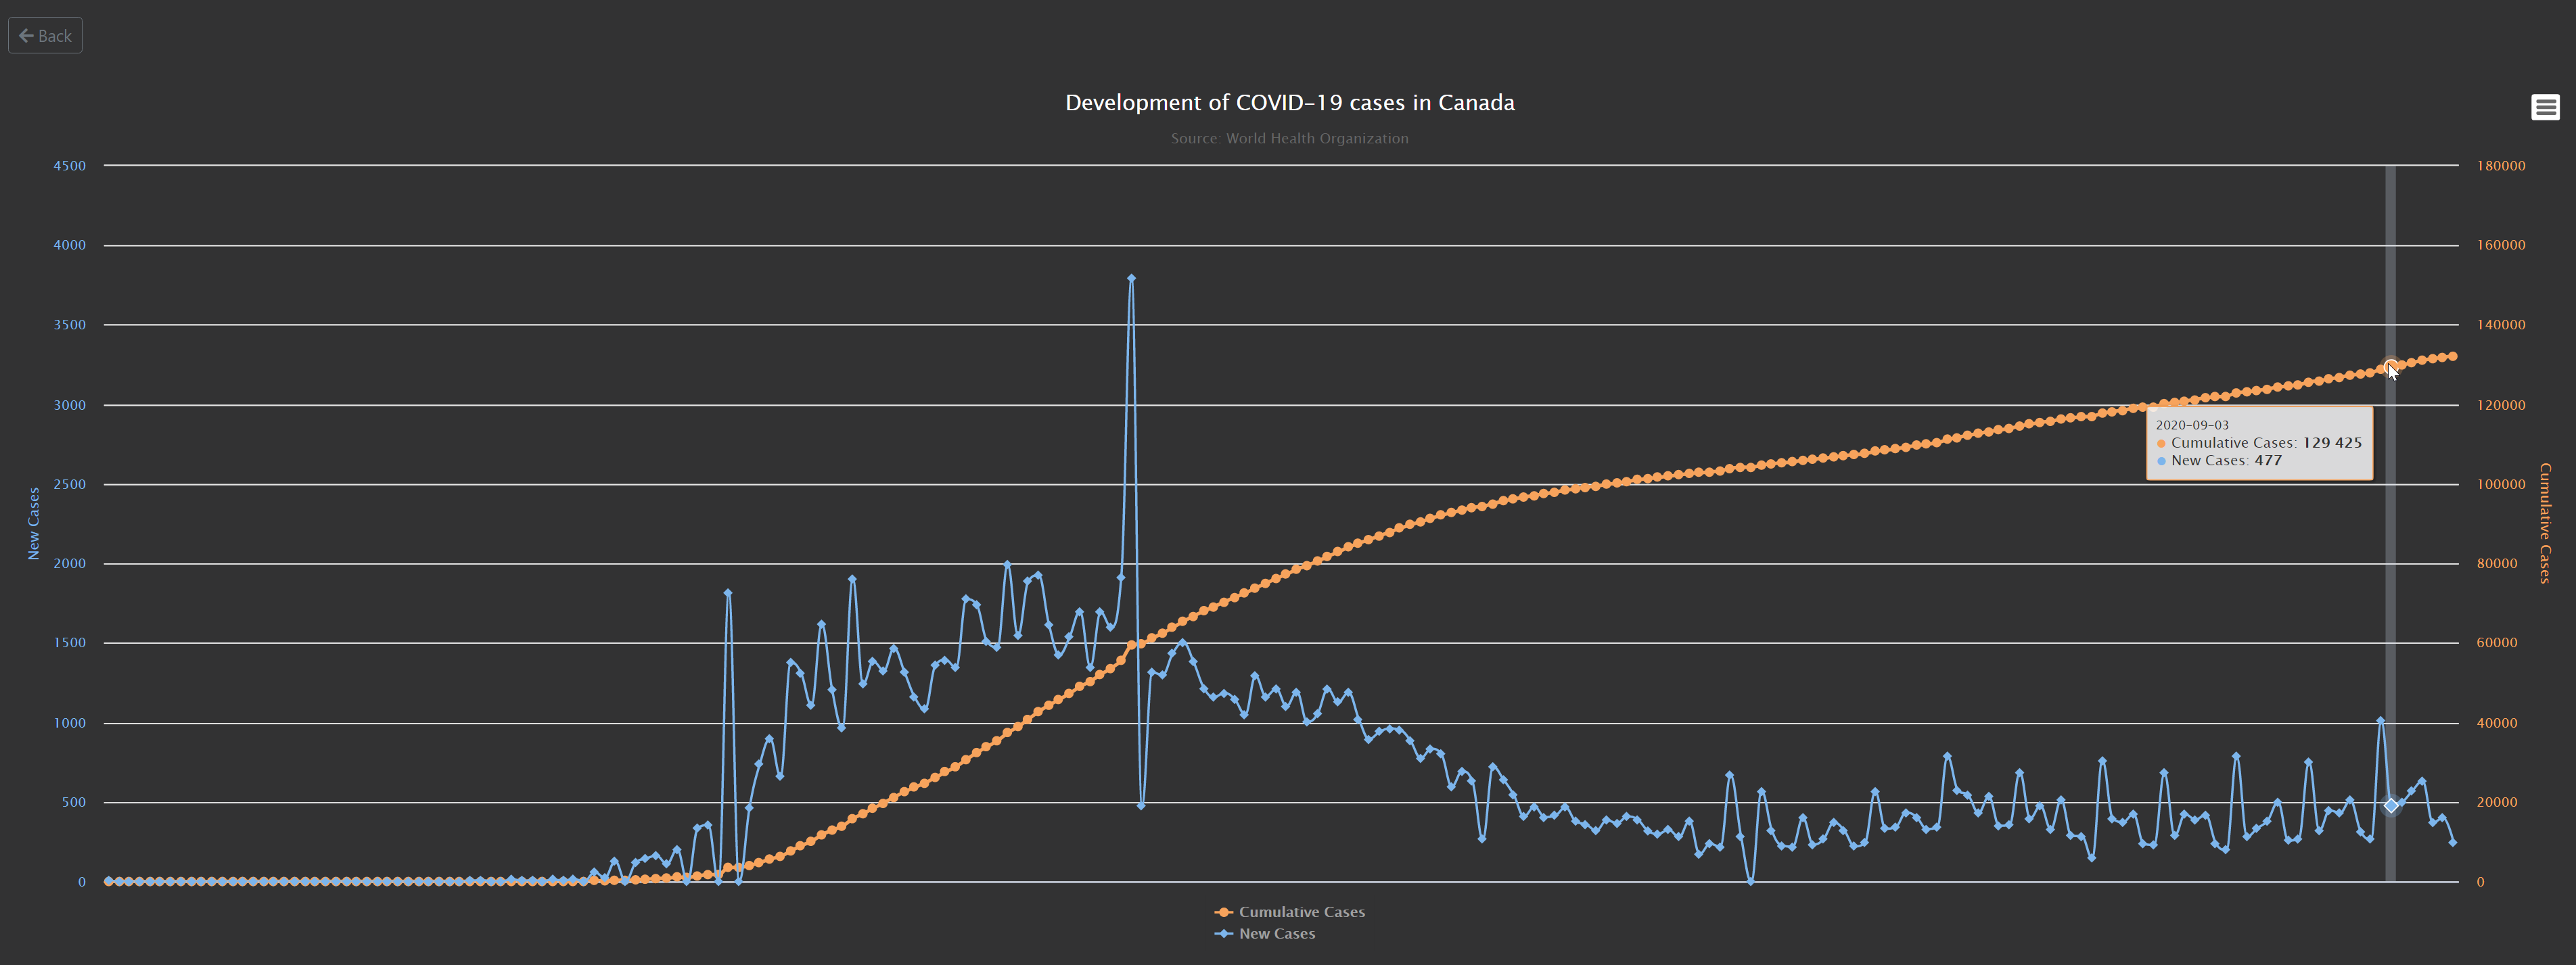
- When a country on the map or in the table is clicked, a new page opens up and displays the time-series of Total Infections and Daily Infections (snapshot below).
Technologies
- Python + Pandas
- Django + Django REST Framework
- Highcharts - Trending & graphing
- HTML5 / CSS3 / Bootstrap